Shopify Shop Campaigns Analytics: How Merchants Can Measure ROAS, CAC & AOV
Shopify Shop Campaigns performance data is now in ShopifyQL. What ROAS, CAC, AOV, sales, and customer metrics actually mean — and how to read them together to make better budget decisions.
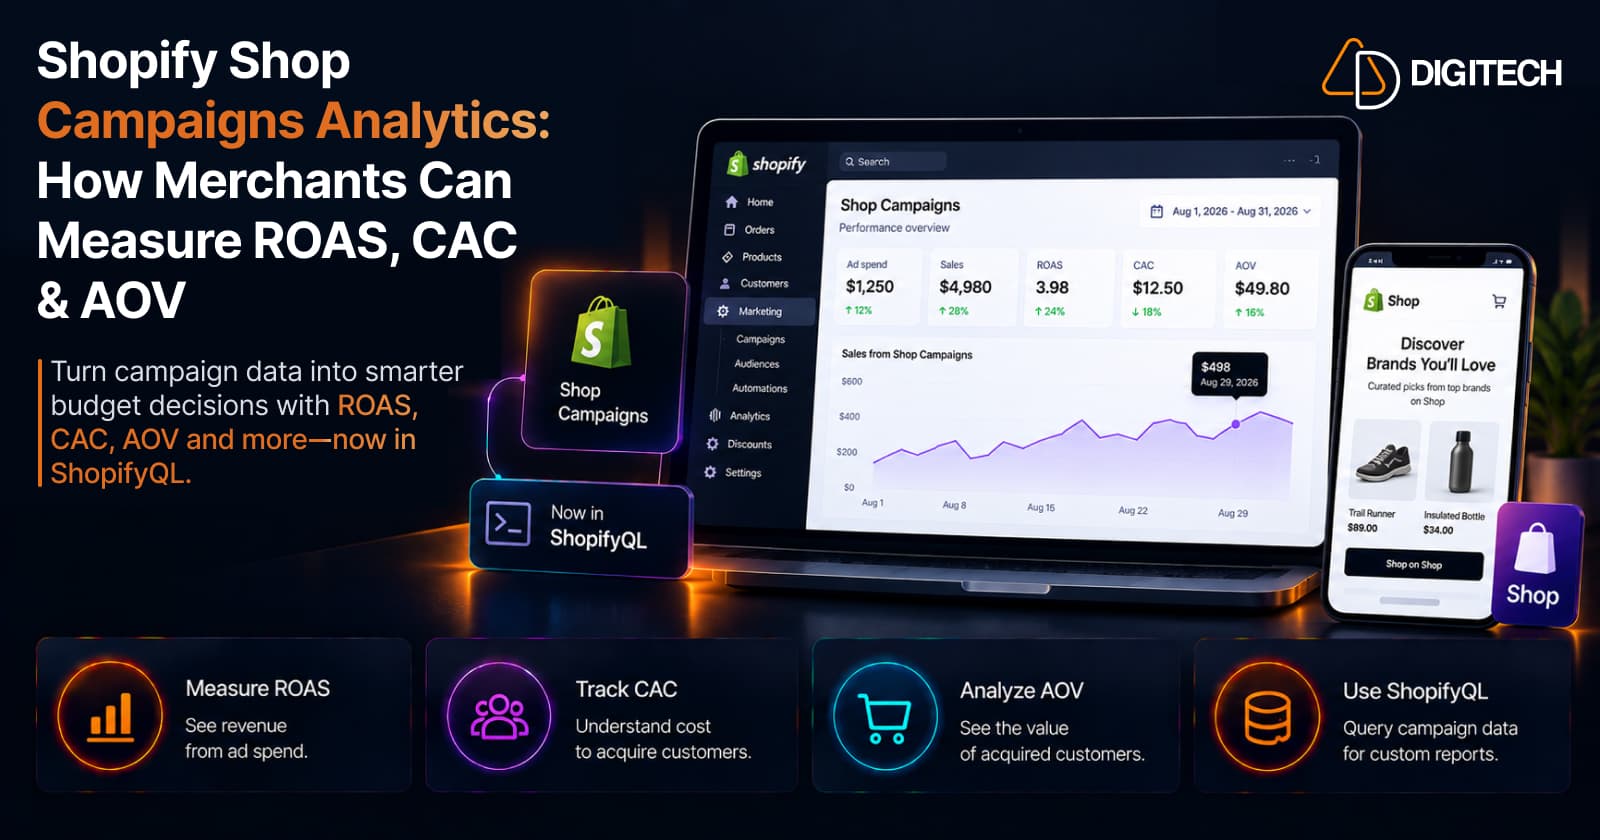
Launching a Shop Campaign is only half the job. The other half is a harder question: did the spend actually work? "We spent $1,000" tells you nothing on its own — what matters is how much revenue that spend generated, what it cost to acquire customers, how valuable the orders were, and which way it's all trending.
As of August 10, 2026, Shopify made that easier. Shop Campaigns performance data is now available through ShopifyQL, alongside the reporting already in the Shopify admin. That opens up a clearer set of business metrics — ROAS, CAC, AOV, sales, and customer counts. But the metrics are only useful if you understand what each one measures, and how they read together. This guide is about that.
What changed with Shop Campaign analytics in 2026?
On August 10, 2026, Shopify added the shop_campaign_insights schema to ShopifyQL. Two things are worth separating:
- Shopify admin reporting — the built-in view of your Shop Campaign performance. Good for a straightforward look at how a campaign is doing.
- ShopifyQL access — the same performance data, now queryable so it can flow into custom reports, dashboards, and analytics or BI tools. Reporting apps can query it on behalf of authorized merchants using the existing
shopifyqlQueryfield with theread_reportsscope, with no new scopes required if they already use ShopifyQL.
In short, the numbers didn't just become visible — they became portable, so you can analyze Shop Campaign performance next to your other data instead of in isolation.
What metrics can merchants see?
The shop_campaign_insights schema exposes six core metrics, with Shopify's own definitions:
| Metric | What it means (Shopify) | Why it matters |
|---|---|---|
| Ad spend | Total ad spend tied to orders associated with Shop Campaigns, in your currency | What the campaign cost |
| Sales | Revenue from orders associated with Shop Campaigns — after discounts, including taxes and shipping. Refunds excluded | The revenue credited to the campaign |
| Customers | Number of customers who placed orders associated with the campaign | How many buyers it brought |
| ROAS | Sales ÷ ad spend (a value of 3 = three times the ad spend in sales) | Sales generated per $1 of spend |
| CAC | Ad spend ÷ customers (customers attributed when their last paid click was within seven days) | What you paid to acquire a customer |
| AOV | Sales ÷ customers (average value of orders associated with the campaign) | The value each acquired customer brought |
One note: the announcement mentions "orders," and the admin shows order counts, but the ShopifyQL schema exposes only the six metrics above — there's no separate "orders" field to query.
ROAS: what does it actually tell you?
Return on ad spend is the headline number, and the simplest:
ROAS = Shop Campaign sales ÷ Shop Campaign ad spend
If a campaign generates $3,000 in attributed sales from $1,000 in ad spend, ROAS is 3 — the orders associated with the campaign produced three times the ad spend in sales.
Here's the trap: a 3x ROAS does not mean the campaign is profitable. ROAS compares sales to ad spend, and nothing else. Sitting outside it are all the costs that decide whether you actually made money:
- Product margins
- Discounts applied to those orders
- Shipping and other operating costs
- Returns and refunds (Shopify's "sales" figure already excludes refunds, but not your fulfilment or return-handling costs)
- The customer acquisition cost itself
A store with 70% margins and a 3x ROAS is in a very different position from a store with 20% margins and the same ROAS. Treat ROAS as an efficiency signal, not a profit statement.
CAC: the cost of acquiring customers
Average customer acquisition cost answers a different question — not "how much sales?" but "how much did each customer cost?"
CAC = Shop Campaign ad spend ÷ Shop Campaign customers
Shopify attributes those customers when their last paid click happened within seven days. So this is specifically the Shop Campaign figure, not a whole-business CAC across every channel.
Why look at CAC when you have ROAS? Because they can disagree. A campaign can post a healthy ROAS while acquiring very few, high-spending customers, or a modest ROAS while efficiently bringing in many new buyers. If growing your customer base matters — not just this month's sales — CAC tells you whether acquisition is affordable. ROAS alone can hide that.
AOV: are your campaigns bringing valuable orders?
Average order value adds a third dimension. Shopify defines it as:
AOV = Shop Campaign sales ÷ Shop Campaign customers
Read that carefully: it's calculated per customer, not per order. Treat it as "how much value did each acquired customer bring," rather than a strict per-transaction average.
AOV is what stops CAC from being misleading. Consider two campaigns:
- Campaign A — lower CAC, lower AOV. Cheap to acquire customers, but each brings a smaller order.
- Campaign B — higher CAC, higher AOV. More expensive to acquire, but each customer is worth more.
Neither is automatically "better." A store selling considered, high-margin products might happily pay B's higher CAC; another might prefer A's volume. The point isn't to pick a winner from one number — it's to weigh the combination against your own economics.
Reading ROAS, CAC and AOV together
The three headline metrics each answer a different question. The mistake is expecting one of them to answer all three.
| Metric | Answers | The useful question |
|---|---|---|
| ROAS | Sales generated relative to spend | Is it producing enough attributed sales per dollar spent? |
| CAC | Cost to acquire a customer | What am I paying to acquire a customer here? |
| AOV | Value per acquired customer | How much is each customer worth? |
Read across the row, not down a single column. A campaign is "working" when the whole picture — ROAS, CAC, AOV, plus the underlying sales and customer counts — fits your business, not when one metric looks good.
Customer segments matter too
Shop Campaign data can be broken out by customer segment — where a lot of the insight lives. Shopify's segments are a defined set:
- New customers
- All other customers
- Lapsed – 3 months
- Lapsed – 12 months
These are Shopify's own segments for Shop Campaigns, not arbitrary custom audiences. The split is useful: a campaign that looks average overall might be acquiring new customers cheaply while barely moving lapsed ones — or the reverse. Segment-level reporting tells you who is responding, so you can judge a campaign against what it was meant to do instead of one blended average.
Time-based reporting: don't judge from one snapshot
Shop Campaign data is available across time dimensions from hourly to yearly, in your store's timezone. Use that range.
A single day's ROAS or CAC can be noisy — a slow Tuesday, a post-payday spike, a one-off large order. What matters is the trend: how performance moves over a week, how it shifts after you change a budget or an offer, and how seasonality plays in. There's no magic "wait N days" rule here; just look at a meaningful window and the direction of travel, not a single point.
How ShopifyQL widens what you can do
Inside the admin, you review a campaign. With the data in ShopifyQL, you can analyze it. Because shop_campaign_insights is queryable — by campaign name, by customer segment, and across time — it can feed custom reports and dashboards, business-intelligence workflows, third-party analytics tools that support ShopifyQL, and reporting that sits alongside your other channels.
You don't need to write ShopifyQL yourself — a capable analytics tool or a developer can do that. What matters for merchants is that Shop Campaign performance is no longer trapped in one screen; it can live wherever you already do your reporting.
A practical Shop Campaign analytics workflow
A repeatable way to read a campaign:
- Check total spend — what did it cost?
- Review attributed sales and orders — what did that spend generate?
- Inspect ROAS — sales relative to spend.
- Review CAC — what you paid per customer.
- Check AOV — the value each customer brought.
- Break it down by segment — new vs. all other vs. lapsed.
- Compare across time — trend, not a single day.
- Weigh it against your own margins and targets — the numbers only mean something inside your economics.
- Decide the adjustment — budget, audience, offer, or creative — if one is warranted.
Resist doubling or cutting a budget off one metric. A great ROAS with a punishing CAC, or a low CAC with an AOV below break-even, are both reasons to look closer first.
Common mistakes when reading Shop Campaign data
The errors that quietly lead to bad decisions:
- Looking only at ROAS. It's the loudest metric and the easiest to misread as profit.
- Ignoring CAC. A good ROAS can hide expensive customer acquisition.
- Ignoring AOV. Cheap customers who place tiny orders aren't always a win.
- Confusing sales with profit. Shop Campaign "sales" include taxes and shipping and exclude refunds — but not your margins or costs. And attribution credits a sale to the campaign; it doesn't prove the campaign caused it.
- Comparing campaigns with different objectives. A new-customer campaign and a lapsed-win-back campaign shouldn't be judged on the same bar.
- Ignoring customer type. A blended number hides which segment actually responded.
- Judging on too short a window. One day is noise, not a trend.
- Comparing across platforms without checking definitions. CAC here uses a last-paid-click, seven-day window, and Shop Campaign AOV is per customer; another tool's numbers may be defined differently.
Shopify admin vs ShopifyQL: which do you need?
Both, depending on the question.
Shopify admin reporting is enough when you simply want to review a campaign's performance and make a call.
ShopifyQL earns its place when a team needs more: custom analysis, broader dashboards, data integrations, or cross-channel views that combine Shop Campaigns with everything else. If reconciling campaign sales back to real money matters, it pairs naturally with reading your Shopify Payments activity, and it fits the same "when native reporting isn't enough" moment as maturing your product and store data.
Not every merchant needs ShopifyQL — use the level of reporting that matches your business.
The bottom line
Shop Campaign analytics now give merchants real visibility into how ad spend becomes sales, customers, and order value — in the admin, and through ShopifyQL for anyone who wants to go further. ROAS, CAC, AOV, sales, and customer counts each answer a different question, and the value comes from reading them together, against your own margins and goals.
The goal isn't to chase one perfect metric. It's to understand whether a campaign's spend is producing the customers and orders your business actually needs.
If your Shopify store needs custom reporting, analytics dashboards, or integrations that go beyond Shopify's native reporting, AD Digitech can help design and build a solution around your existing Shopify stack. See our Shopify store development work, or talk to us about your reporting workflow.
Frequently asked questions
What are Shopify Shop Campaigns?
Shop Campaigns are Shopify's native advertising campaigns that promote a merchant's products to shoppers, managed inside Shopify. This article is about their performance analytics — as of August 10, 2026, Shop Campaigns performance data is available through ShopifyQL via the shop_campaign_insights schema, in addition to the reporting shown in the Shopify admin.
How is Shop Campaign ROAS calculated?
Return on ad spend is Shop Campaign sales divided by Shop Campaign ad spend. A ROAS of 3 means orders associated with the campaign produced three times the ad spend in sales. It measures sales relative to spend, not profit — margins, discounts, shipping, and refunds still sit outside it.
What is CAC in Shopify Shop Campaigns?
Average customer acquisition cost is Shop Campaign ad spend divided by the number of customers attributed to the campaign. Shopify attributes those customers when their last paid click happened within seven days. In plain terms, it's roughly what you paid to acquire one customer through the campaign.
How does Shopify calculate Shop Campaign AOV?
In the Shop Campaigns schema, average order value is Shop Campaign sales divided by Shop Campaign customers — the average order value associated with the campaign, in your store's currency. Note it's calculated per customer, so read it as the value each acquired customer brought rather than a strict per-transaction figure.
Can Shop Campaign data be accessed through ShopifyQL?
Yes. Since August 10, 2026, the shop_campaign_insights schema is available in ShopifyQL. Analytics and reporting apps can query the data on behalf of authorized merchants using the existing shopifyqlQuery field with the read_reports scope — no new scopes are required if an app already uses ShopifyQL.
Can merchants compare Shop Campaign performance by customer segment?
Yes. The data can be broken out by Shopify's Shop Campaign customer segments — New customers, All other customers, Lapsed – 3 months, and Lapsed – 12 months — as well as by campaign name and by time, from hourly to yearly in your store's timezone.
Building something on Shopify?
We design, build, and maintain Shopify apps, stores, and AI products — to the standard this article describes.
Related reading
Shopify Shop Checkout Gets Faster: What Merchants Need to Know
Shopify's October 5, 2026 Shop update brings faster checkout and carts that sync across devices. See how it works, who qualifies and what to check before BFCM.
Read article
Shopify Analytics Annotations: How Merchants Can Add Context to Their Store Data
Shopify Analytics annotations let merchants add campaign, pricing and operational notes to reports. See how they work, the limits, and how to use them for BFCM.
Read article
Shopify Canvas Explained: How AI Is Changing Shopify Store Design in 2026
Shopify Canvas, announced October 1, 2026, lets merchants design a store with Sidekick. See how it works, its current limits, and what it means for developers.
Read article
Shopify's New Market-Driven Shipping Is Rolling Out: What Merchants Need to Know
Shopify Market-Driven Shipping began rolling out on October 1, 2026. See what changes, who is affected, and what to check before BFCM.
Read article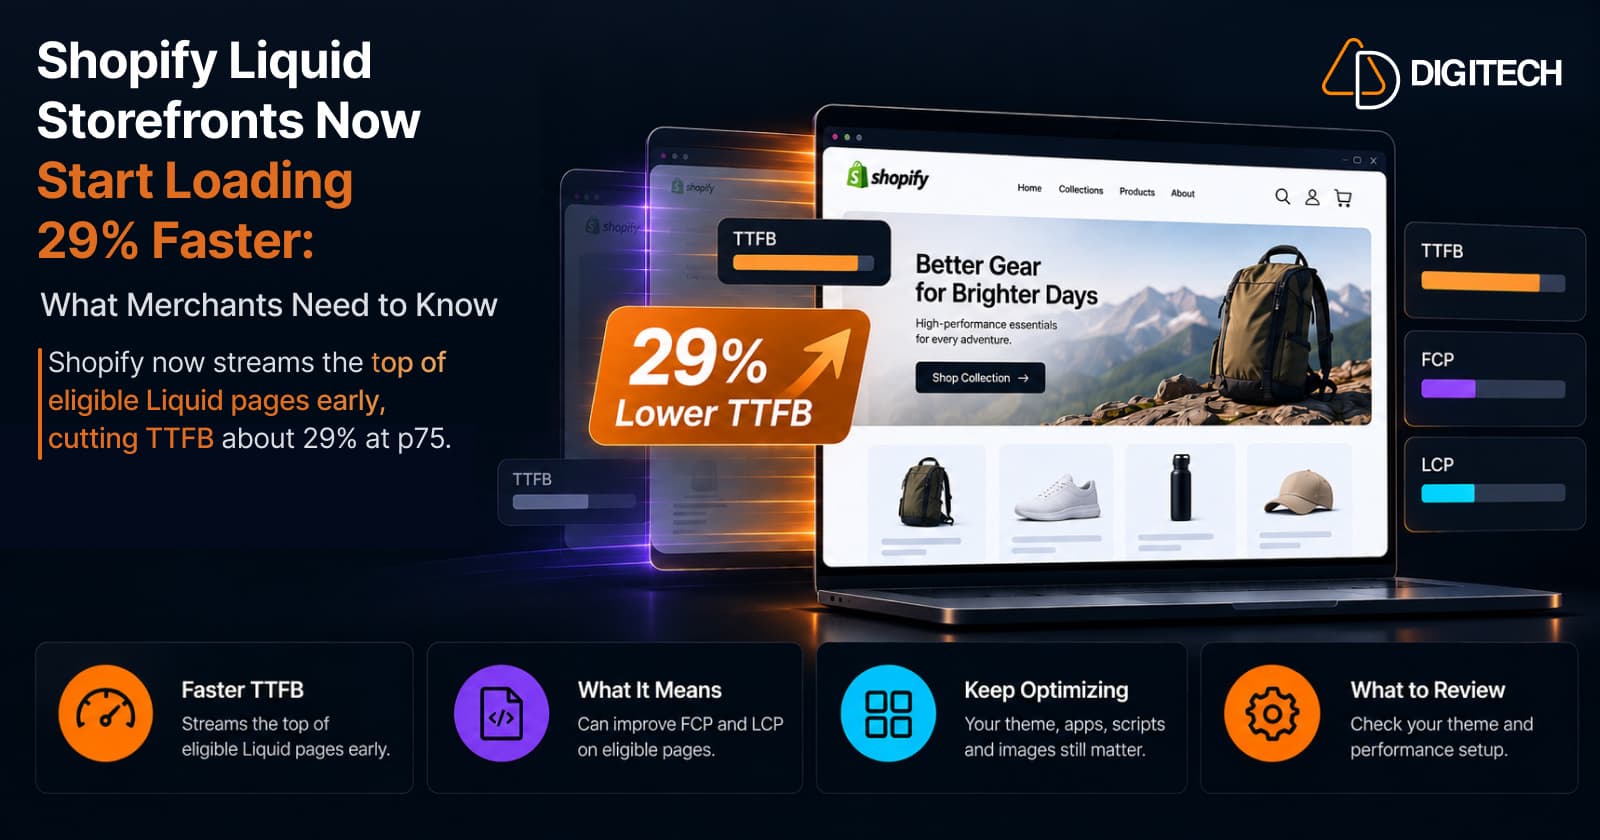
Shopify Liquid Storefronts Now Start Loading 29% Faster: What Merchants Need to Know
Shopify now streams the top of eligible Liquid pages early, cutting TTFB about 29% at p75. What it means for FCP, LCP, your theme, and what still needs fixing.
Read article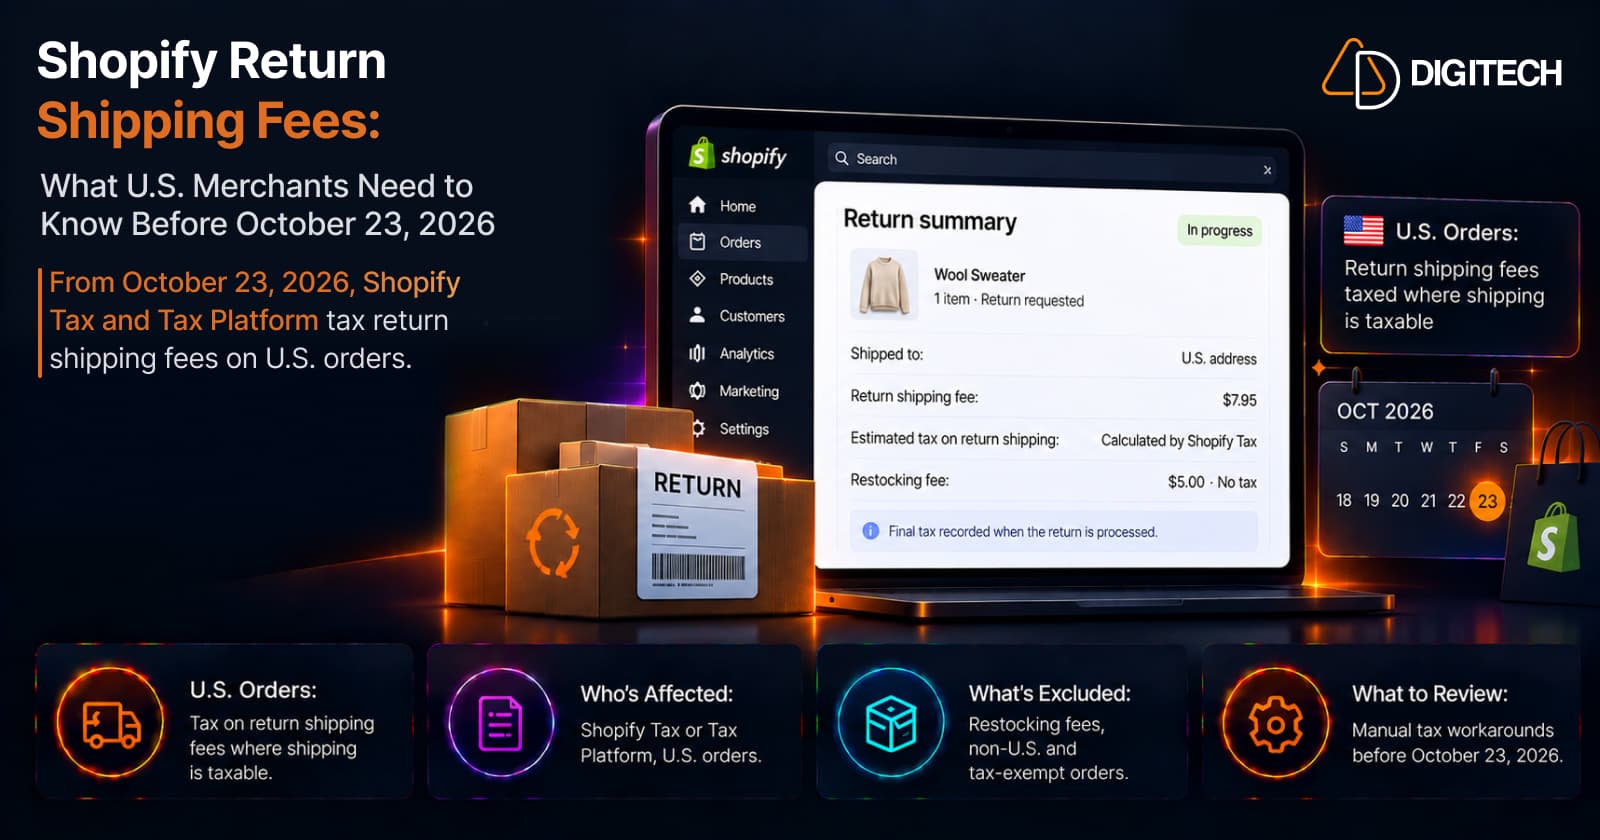
Shopify Return Shipping Fees: What U.S. Merchants Need to Know Before October 23, 2026
From October 23, 2026, Shopify Tax and Tax Platform tax return shipping fees on U.S. orders. Who's affected, what's excluded, and what to review.
Read article
Shopify BFCM Product Page Optimization: What to Fix Before Black Friday
Shopify BFCM product page optimization: which pages to fix first, what to fix now vs later, a 9-week timeline to Black Friday 2026, and a final checklist.
Read article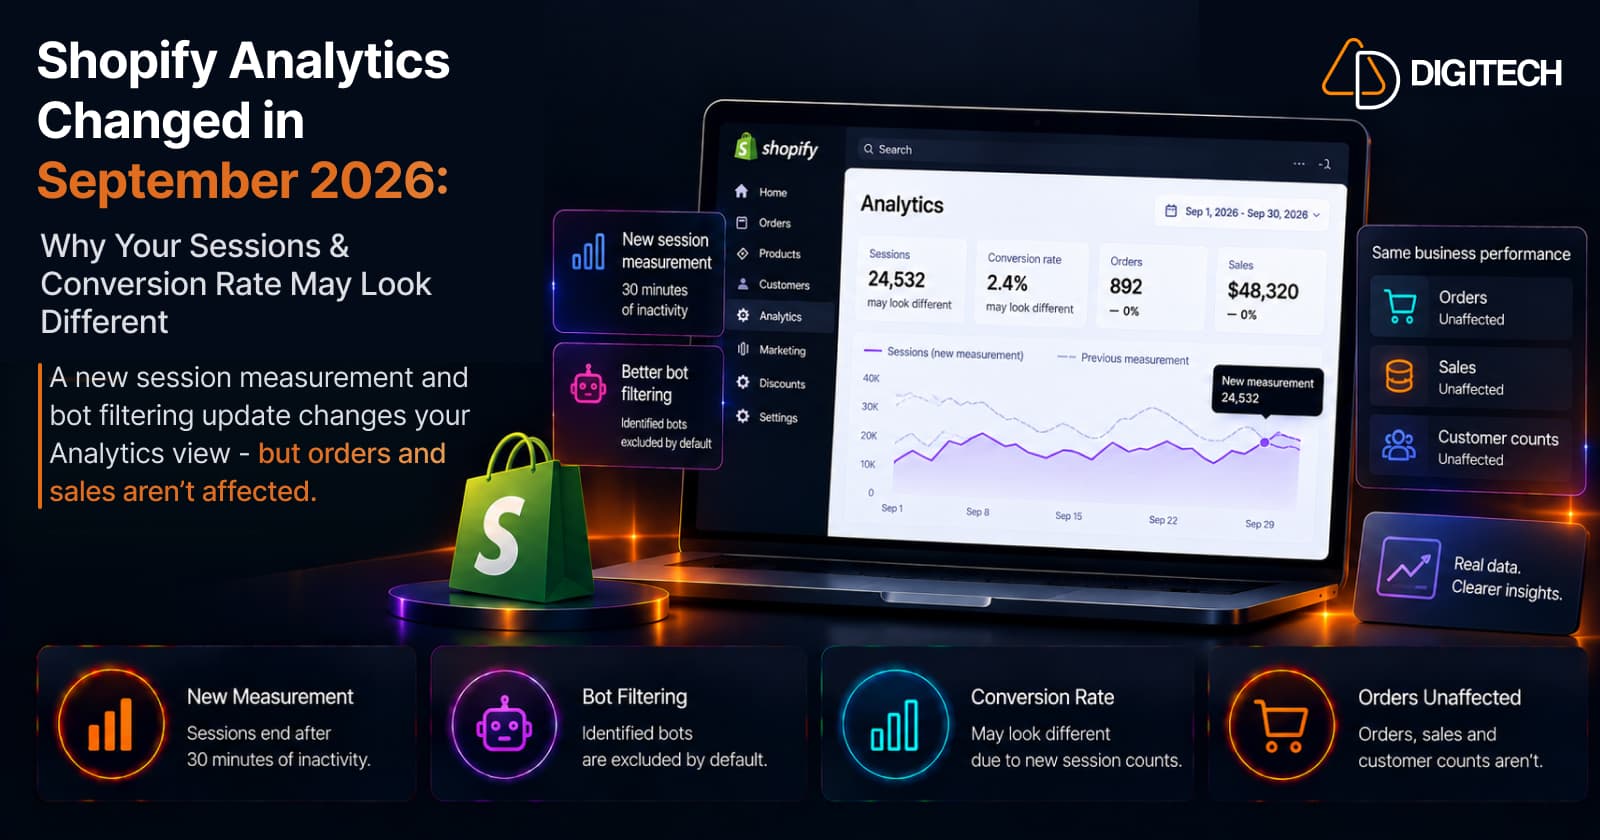
Shopify Analytics Changed in September 2026: Why Your Sessions & Conversion Rate May Look Different
Shopify's Sept 21, 2026 Analytics update changes how sessions are measured, so sessions and conversion rate may look different — but orders and sales aren't affected.
Read article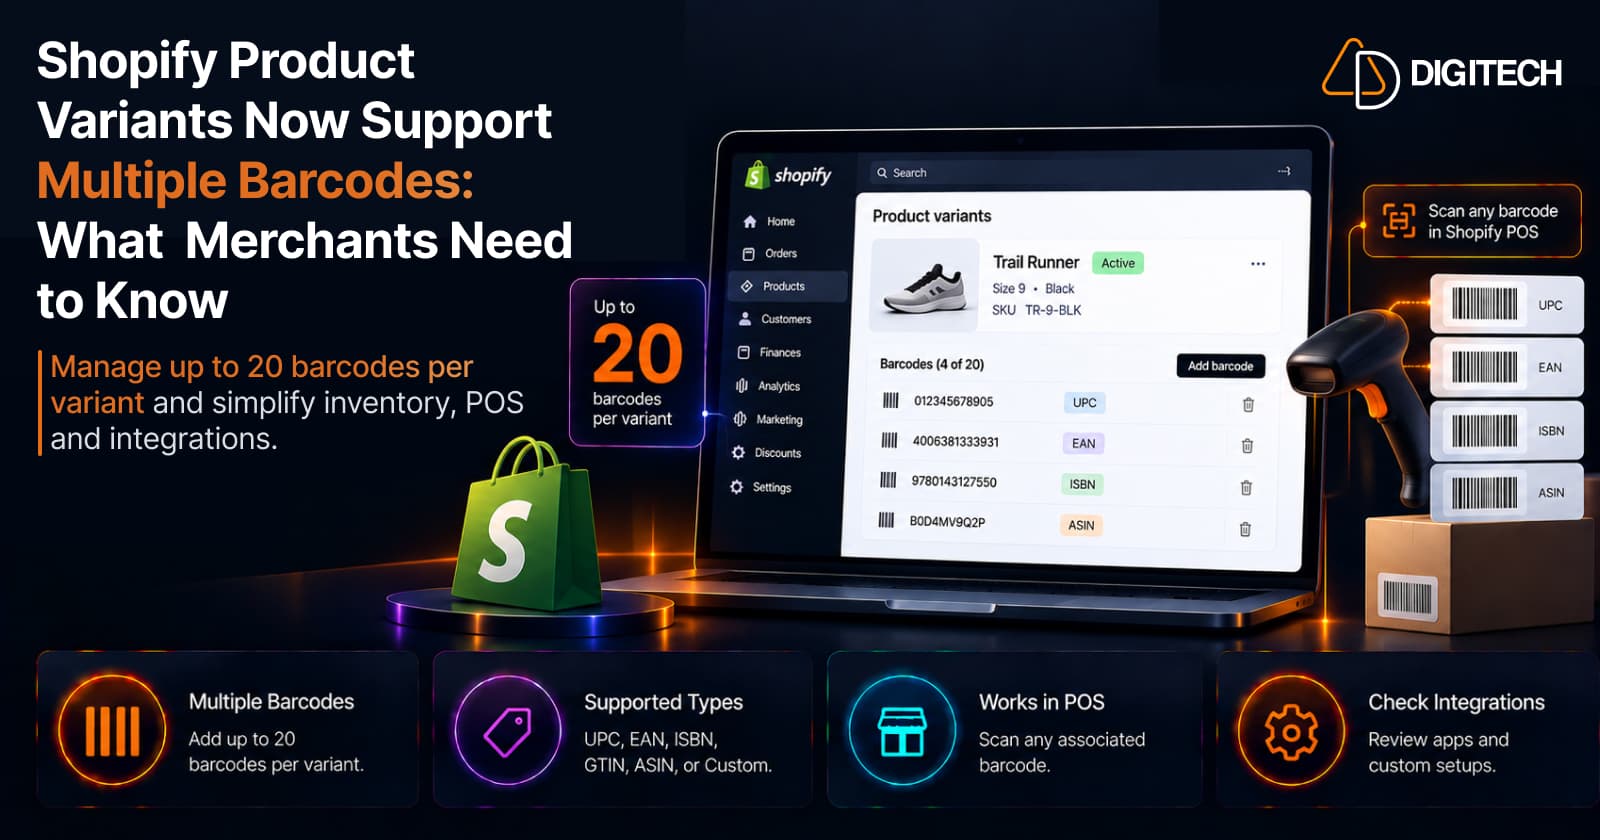
Shopify Product Variants Now Support Multiple Barcodes: What Merchants Need to Know
Shopify product variants now support up to 20 barcodes each. What changed, how it works, who benefits, and what to review in your product, inventory, POS, and integrations.
Read article